

I don’t honestly know if I have mentioned this yet, but I am a first-year student of psychology at the University Of Winchester. Psychology has a lot of statistics like every science and I am not a huge fan of this. It stresses me out like crazy and I think if I don’t do something soon, my brain may fall out of my ears from pure rage alone at the thought of ANOVA tests, Confounding variables and whether or not I need to discard the null hypothesis because it was statistically significant after all.
Therefore, I am going to attempt to try and solve this issue, by placing all of my notes on this blog and hopefully, that not only fulfils my need to keep this blog active but also will aid me in my revision somewhat.
So, grab a cup of tea, coffee, juice or milk (the, café, jus and lait for those who are French, I am just showing off now) and get ready for what will hopefully be a decent journey into the world of statistics.
Yes, I do understand that this is a long time coming and i can only apologise but a lot has happened lately.
If you need a moment to calm down at the thought of learning about statistics, that is quite understandable. I shall place what I think is a calming song below.
As a quick side note, I may cover some research methods as well and don’t expect this to be the only part. I may or may not do a part two. We shall see.
Let us begin with the types of data that can occur.
Nominal data is where numbers are used to represent names such as football numbers on t-shirts, student ID numbers and phone numbers or labels such as gender, eye colour and ethnicity having numbers to represent them. These numbers have no mathematical value and so means and standard deviations are ineffective.

Ordinal data covers simply the order of performances. This includes test scores, race placements and simply the order in which something is done. Both nominal and ordinal are both incapable of full statistical analysis and ultimately need non-parametric tests to be analysed effectively.

Interval data covers everything that has an equal amount between each number such as age, time or height. These tend to have a zero point and can be expressed as positive or negative numbers.

Ratio data is all data that has a mathematically meaningful zero point and can be in decimals. A data value being able to have decimals is also known as being continuous.

Also worth noting, the opposite of continuous data, is discrete. Both Ratio and Interval data need parametric tests to fully understand them.
So, now we have a basic understanding of statistics. I think we should move onto theories and hypothesis. Wait, are they now different things? Yes.
A theory stipulates an “if” question that we need to test with a then sentence. If people are more intelligent on the toilet, then an IQ test on the bog should get higher results. If staying up late makes us tired, then we should yawn more the later the evening progresses. The hypothesis is then the “then” part of all the previous statements.

If cute cats calm me down, then I should feel less stressed after petting them. Yes, the cat shown above is my own so you can’t have her. Her name is Purdey.
No truly scientific theory can be proven true. It can be supported until we find evidence to discredit it but for complicated reasons that involves falsifiability and the fact that all theories have to have them, you can only falsify theories and not ever really prove them to be true. This is why the psychodynamic theory is not true science.
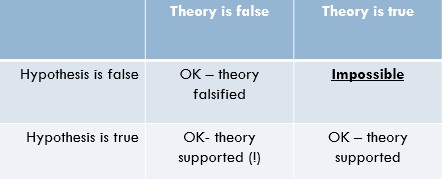
So, with this in mind, it is only logical to conclude that if the theory is false, and the hypothesis is false, the theory is falsified. However, the theory can be false, while the hypothesis is true and this still supports the theory. It is not possible to have a false hypothesis if the theory is true. A table below displays this in a clear way.
NB: Falsifiability only applies to science. Maths, philosophy, history and many an other subject do not gel well with this idea.
If you ever hear anyone referring to the levels of a variable, this just means the category that variable belongs to, for example, religion could have the levels of Sikh, Muslim, Christian, Jewish, Buddhist or Hindu. Someone’s birthday would have 366 potential levels.

Calculating the standard deviation is all based on the fact that the score for each participant can be considered as the model (or mean) plus the standard error. Therefore, to work backwards we need to take the standard error and take way the mean from it, this then needs to be squared, as the number cannot be negative. All of this is then divided by the degrees of freedom, minus 1 as we are only looking for one number. This will equal a squared version of the standard deviation also called the variance, so in order to adjust this, find the square root of the final number. Easy.
NB: the smaller the standard deviation, the more accurately the mean’s representation in your sample was.
Let’s talk about graphs for a moment.

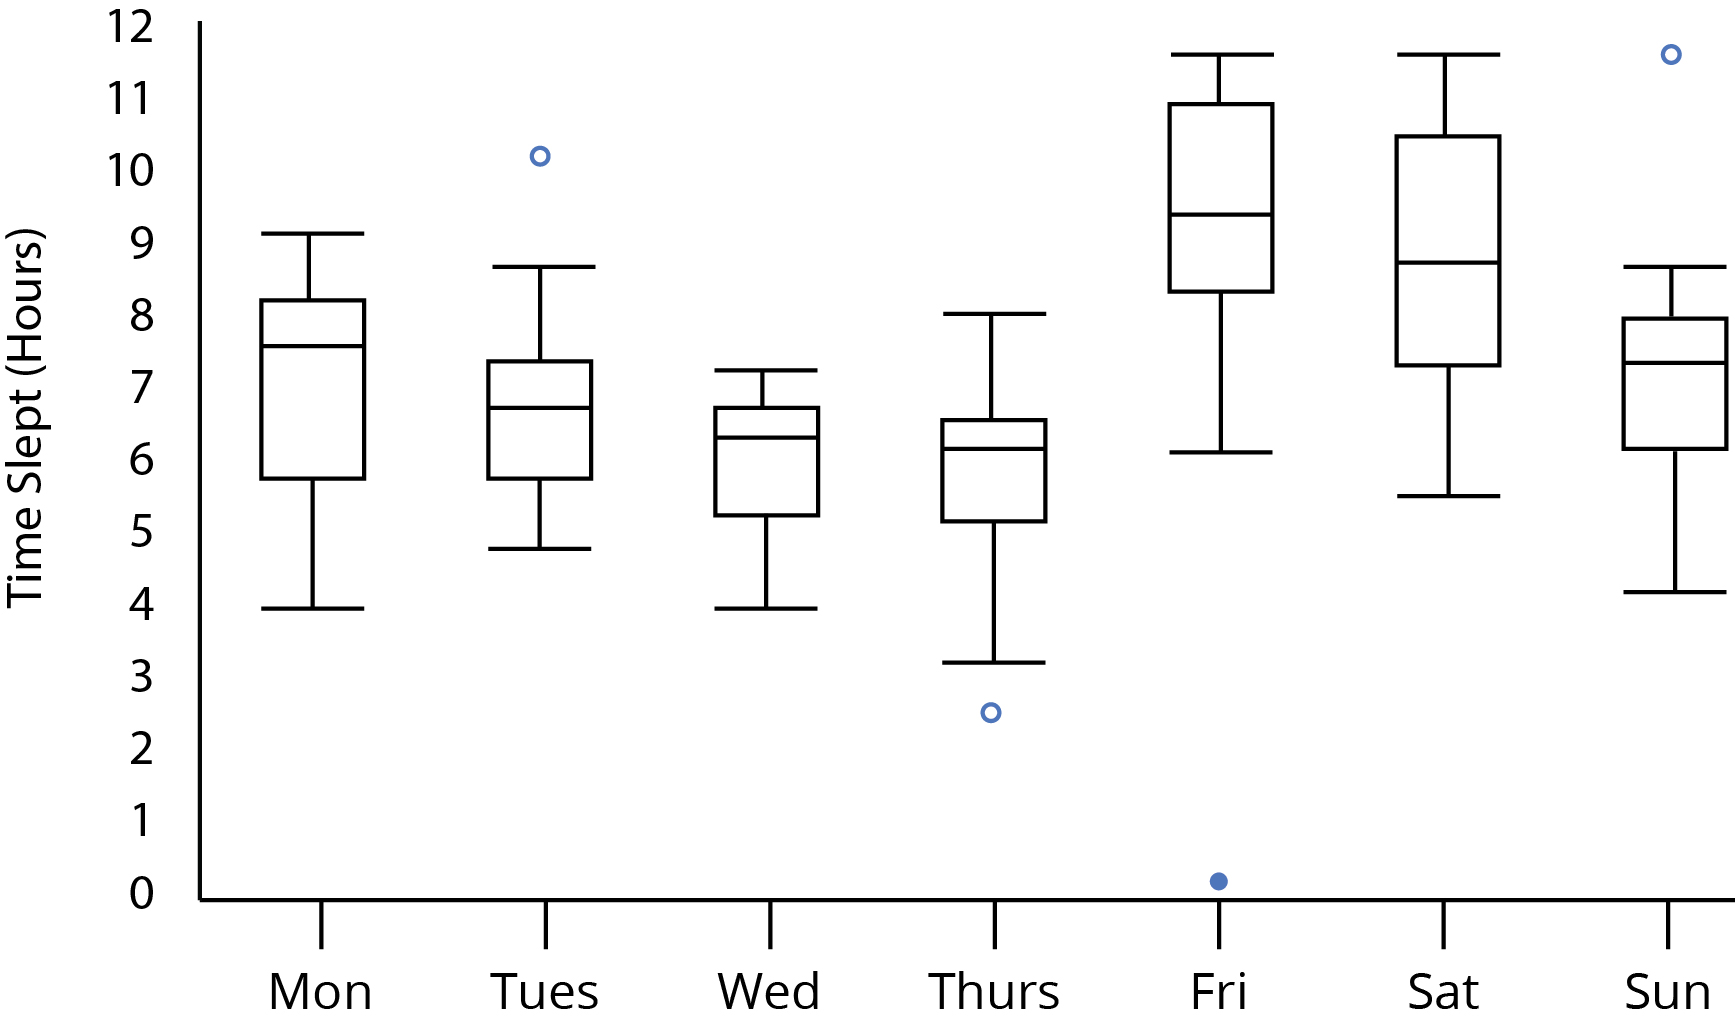
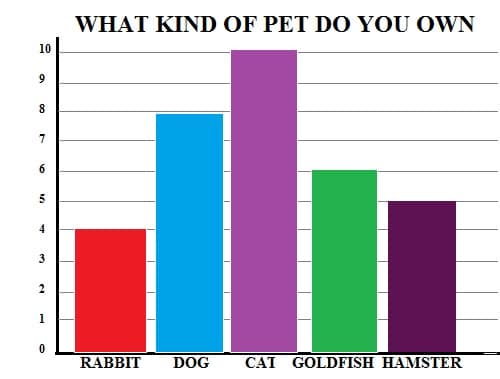
Histograms are bar charts that are close together and are useful for seeing normal distributions.
Pie charts are not used in psychology statistics.
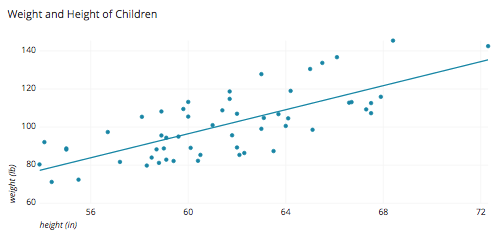
Let’s discuss designs for a moment. Correlational designs do not have levels as they are just observations of variables.
A between subjects design or independent groups design means that each subject only completes the experiment with only one level of the IV.
A within subjects design or repeated measures design means that every participant completes the experiment multiple times with all the different levels of the IV.

What else might you need to know? How about knowing what statistical test is appropriate? YAY! MY CAPS LOCK IS STUCK ON FROM ALL THE SARCASM!
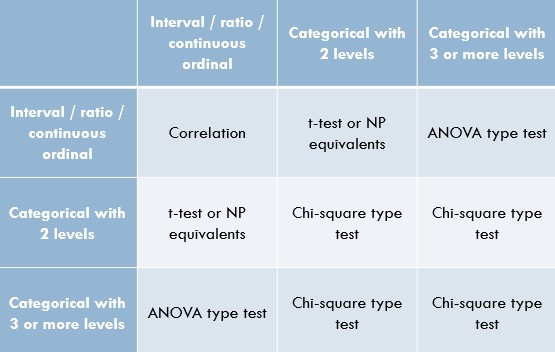
Firstly, we need to know what the scales of measurement are? This basically means, are the two sets of data we are comparing, Nominal, Ordinal, Interval or Ratio? If both variables are Nominal, then use either chi-square tests or variants of the like. If one variable is interval/ratio and the other is nominal then it is best to use a t-test or an ANOVA. If both are Interval or Ratio then use a correlational test.
Ordinal data is more tricky to analyse and you are best of thinking about it as if the data seems to be a set of categories, treat it like it is nominal, if not, treat it like it is interval/ratio data.

Now, coming back to what I said earlier about levels, you will see in the above text that I mention that if you have data where one variable is nominal and the other is interval/ratio then use should choose between either a t-test or ANOVA test. The way you choose between these is based on the number of levels of data you have. If you have only two levels, then use a t-test, but if you have any more then this, you are best off using an ANOVA test.
Of course, then you need to consider if you have a within or between subjects design as this will slightly change the test again as each test has equivalents for both circumstances. A between subjects design would mean using an independent t-test or independent ANOVA and a within subjects design would mean using a paired samples t-test or a repeated measures ANOVA. However, if you have a correlational design, this doesn’t really apply so don’t worry about it.
So, what is the difference between a parametric test and an non-parametric test? I am so glad you asked. Basically, parametric tests are more powerful and are preferred if it is possible to use them. So, if that is true, why do we have non-parametric test in the first place? Good question. Parametric tests make assumptions about the data (homogeneity of variance, normality, sphericity, heteroscedasticity…) and if these assumptions are violated, it is best to either fix them if you can or do a non-parametric test instead.
So, what are the non-parametric tests. Well, they all have parametric equivalents so the best way to present them to you would be though naming them along side what they closely resemble. The independent t-tests non-parametric sister is the Mann-Whitney test. The dependent t-tests non-parametric brother is the Wilcoxon test. The independent ANOVA’s non-parametric father is the Kruskal-Wallis test. The repeated measures ANOVA’s non Parametric mother is the Friedman test.
Thank you for reading and sorry for the wait.
 Patrick Pertwee's Perculiars
My brain hurts. 🤯
LikeLiked by 1 person